
Fly over a year of energy
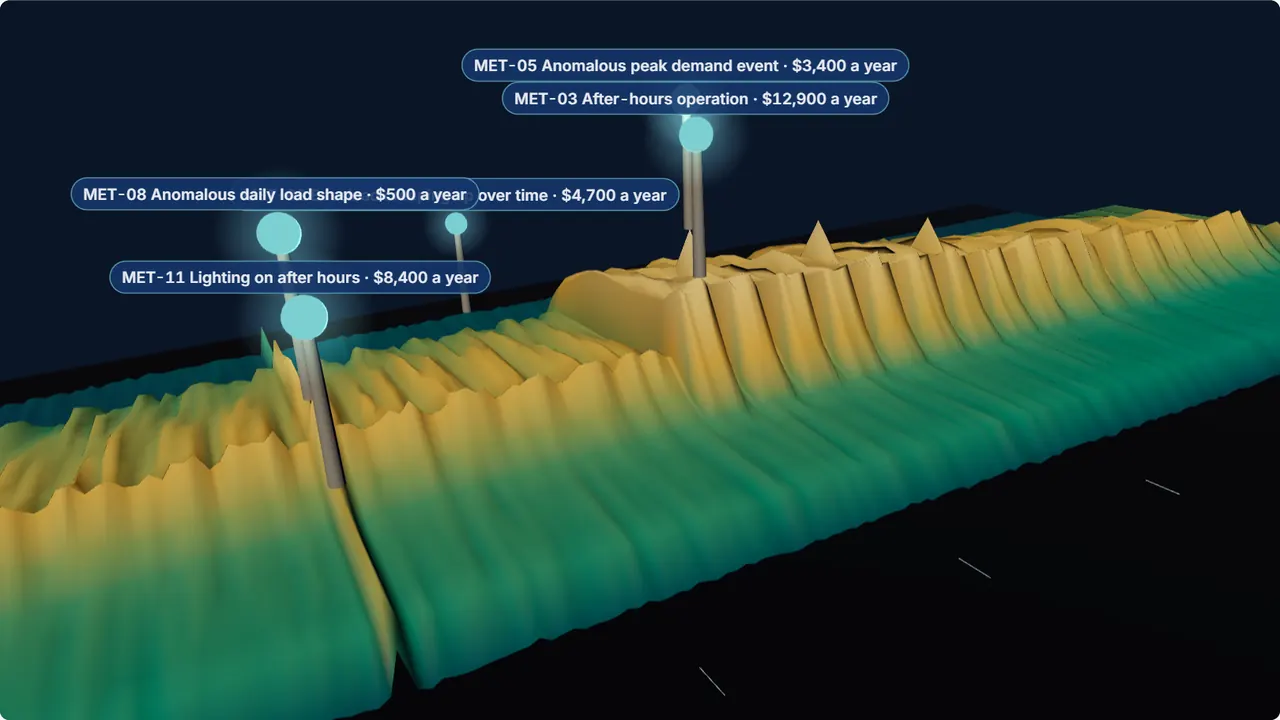
The same picture an analyst starts from, stood up: each day is a ridge, each hour a step along it, and the height is the power being drawn. This is the synthetic school behind the Pelorus home page, with the six faults an Energy Agent run found standing where they happened. Drag to look round; the flight resumes when you press play.
This browser cannot draw the 3D view. The same year is in the heatmap below, and on the Check my data page.
Found so far: $0 a year
January. The flight runs the year left to right; a pin rises where a finding was made.
Drag to look round, scroll to zoom. Taller is more power; brighter is more power too.
- MET-03 After-hours operation $12,900 a year Found by an engineering rule
- MET-11 Lighting on after hours $8,400 a year Found by an engineering rule
- MET-04 Weekend load shape looks like a weekday $13,600 a year Found by an engineering rule
- MET-05 Anomalous peak demand event $3,400 a year Found by a statistical model
- MET-02 Baseload creeping up over time $4,700 a year Found by a statistical model
- MET-08 Anomalous daily load shape $500 a year Found by machine learning
Navy is the night floor, teal the working day, cream the peak. January is on the left, midnight at the back.
The school is synthetic and the six faults were put in on purpose; the dollars are the same fixed rates the home page uses ($0.12 per kWh, $12 per kW for four months). Each pin links to the rule that found it.
Now fly over yours
Drop in a year of utility interval data (CSV or Green Button). It is read here, in your browser, and nothing is uploaded. The landscape above becomes your building: the water is your night floor, the gold pin your peak, the small pins each month’s peak, and the land is darker outside the hours you set.
Looking for : drop a year in and the heatmap shows whether it is there.
Or drop the file on this box. A CSV or a Green Button XML file, hourly or 15-minute; a longer export keeps its latest three years. It is read here, in your browser. Nothing is uploaded. Not sure how to get one? How to ask your utility for interval data.
Your year
A first look, not the analysis. Four figures from the meter alone, worked out by simple arithmetic. Energy Agent runs 96 engineering rules and machine-learning models on the same file (11 of them on the meter, the rest on BAS trends), prices every finding at your tariff, and an engineer reviews the result. What the full run covers · what your data would unlock
Each column is a day, each row an hour, midnight at the top. Bright bands at night, weekends that look like weekdays and single bright spikes are the things worth asking about.
- Night floor
- –
- A weekend day
- –
- Peak
- –
- Highest month’s peak
- –
What the building draws between 1 and 4 am, with nobody in it. MET-01 asks whether that is too high for this building.
of a weekday’s energy. Near 100% in a building that closes at weekends is the question MET-04 answers.
Load factor –.
above a typical month. At a typical $12/kW demand charge that one month cost – more. MET-05 finds the hour it happened.
Outside your occupied hours
– a year above the night floor, at most
This is the after-hours arithmetic published on the MET-03 page, fed from your file: average load above the night floor, times the hours a week the building is scheduled empty. It is an upper bound: start-up, cleaning and refrigeration are in there too. Change the hours above to match your building.
What this first look cannot tell you
It cannot tell which of this is a fault, what is causing it, or what it costs at your actual tariff. Energy Agent runs 96 engineering rules and machine-learning models over the same file, with your weather and schedule, and an engineer stands behind the result. Your first building is free.
Thanks. Your message is in.
A Pelorus engineer will reply within one business day and ask for the file.
A first look, not an analysis: descriptive arithmetic you can check by hand. Which findings are real, what causes them and what they cost at your tariff is what Energy Agent and a Pelorus engineer work out.
Your first building is free.
Send twelve months of interval data, a BAS trend export, or just the bills. You get a screening-level report of what the building is wasting, what that is worth at your tariff, and what to do first. One building per organisation, no sensors, no installation, no commitment.